Pick the guide that matches what you're here to do. Setup is a one-time job for one admin — everyone else just reads incidents.
This is the setup reference for whoever connects tools and configures Stratos — a one-time job, usually done by one admin. Everyone else on the team only needs the Viewer guide.
Part A — Connect Your Tools
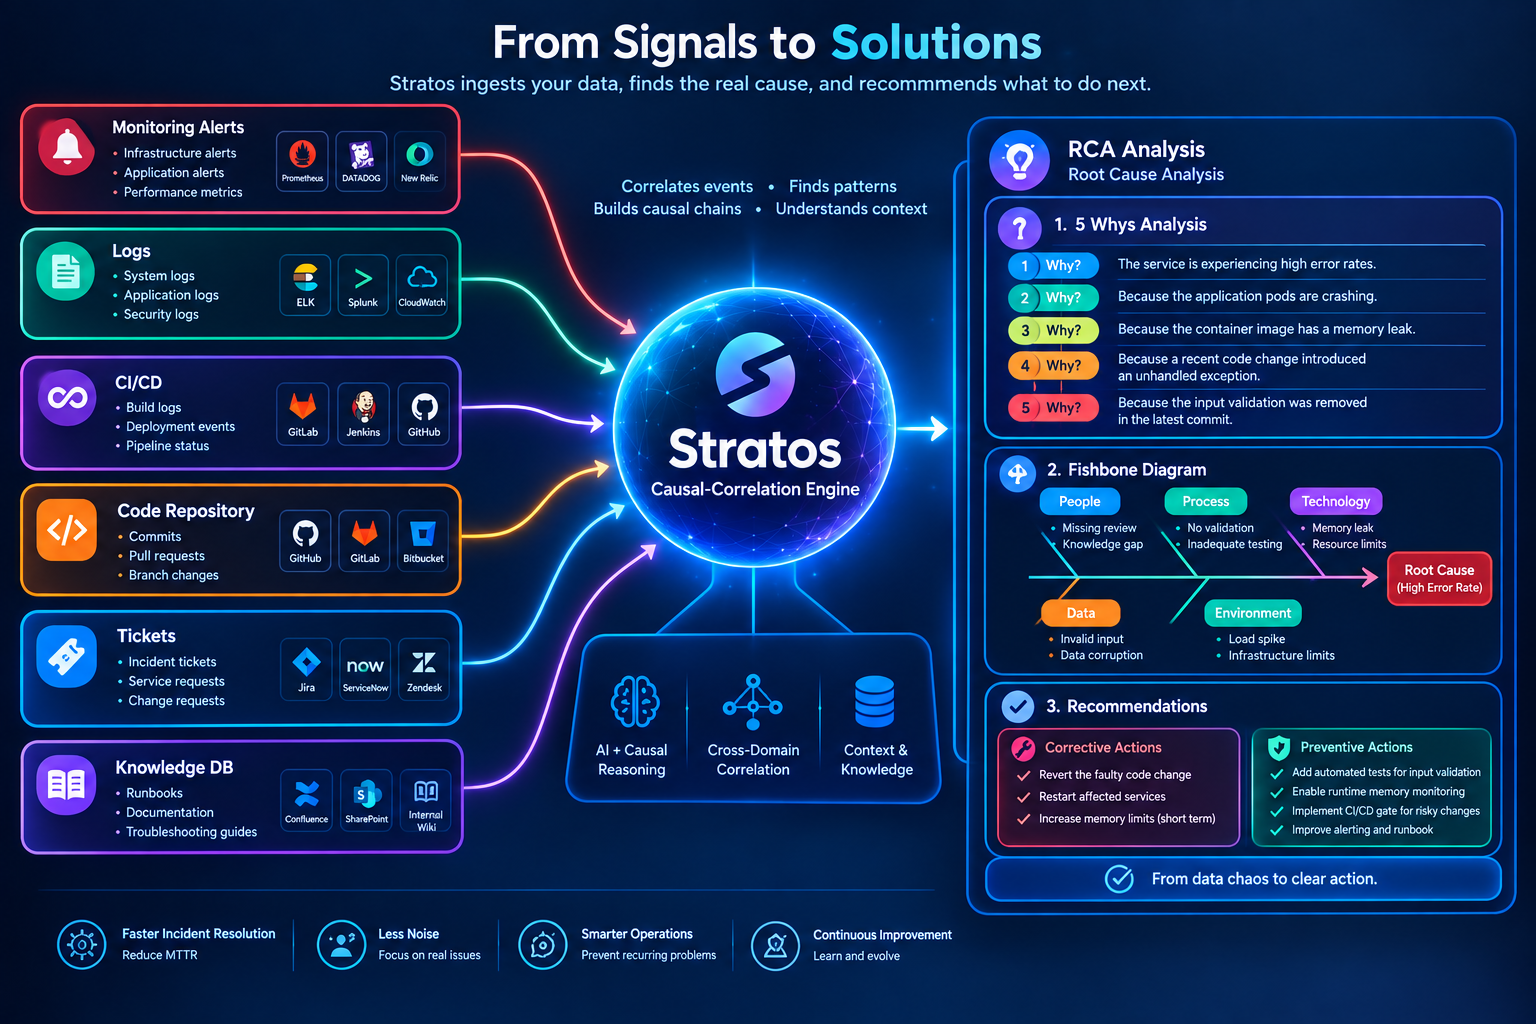
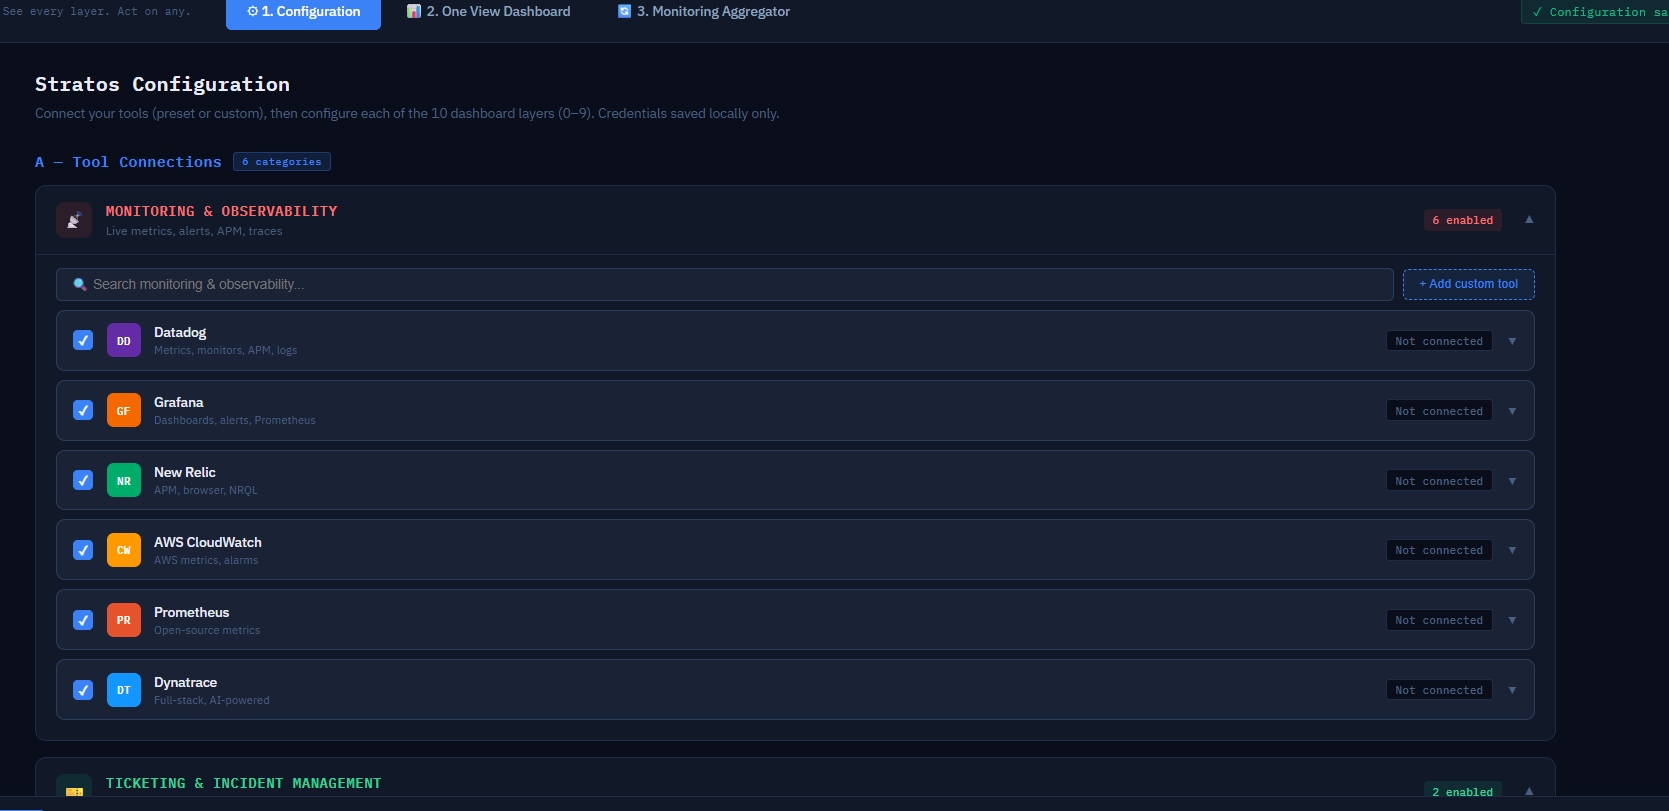
Stratos pulls data from your monitoring, ticketing, code and knowledge tools, maps it onto your business flow, and correlates it down to a single most-likely root cause. Connect tools in this order:
| # | Category | What it's for |
|---|
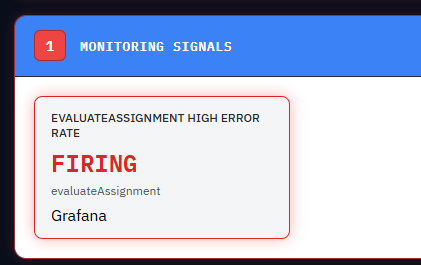
| 1 | Monitoring (Grafana) | Live alerts — the primary signal an incident is happening. |
| 2 | Ticketing (Jira / ServiceNow) | Tickets as an alternate trigger; auto-creates/updates tickets during an incident. |
| 3 | CI/CD (GitHub) | Recent commits/deploys as extra root-cause evidence — "deployed 12 min before the incident." |
| 4 | Knowledge (Confluence / Docs / KB) | Past-incident history and matched runbook steps. |
| 5 | Layer Configuration (Part B, below) | Your business stages, dependencies, apps, on-call, SLAs. |
| 6 | On-call / Comms / Logs / Infra | Paging, Slack posting, log search, CMDB. |
Tool-by-tool setup
📡 Monitoring — Grafana
Why: the primary trigger — live firing alerts are what a real incident looks like.
- In Grafana: Administration → Users and access → Service accounts → Add service account, role Viewer (read-only).
- Open it → Add service account token → copy the token (shown once).
- In Stratos Configuration → Grafana card → paste the URL and token.
- On Grafana Cloud, also fill the CORS proxy field — Grafana Cloud doesn't allow direct browser calls otherwise.
- Test connection, then Extract dashboards & alerts.
Read-only — Stratos never writes to Grafana.
🎫 Ticketing — Jira
Why: lets a support ticket trigger an incident, and posts runbook comments back to it.
id.atlassian.com → Security → API tokens → Create API token (classic, not "with scopes").- In Stratos: fill Jira URL, account email, the token, and your Project Key (e.g.
OPS).
- Fill the CORS Proxy field — Atlassian blocks direct browser calls too.
- Test connection, then Save Configuration.
Read-only by default; auto-ticket-creation is a separate opt-in checkbox.
🔀 Code Repository & CI/CD — GitHub
Why: a commit or deploy shortly before an incident is one of the strongest root-cause signals.
- GitHub → Settings → Developer settings → Fine-grained personal access tokens → generate one scoped to only the repo that backs the affected service.
- Permissions → Contents: Read-only (optionally Actions: Read-only too).
- In Stratos: fill Org/Owner, Repository, and the token. No CORS proxy needed here.
💬 Communications — Slack
Why: post incident updates straight to your team's channel.
One-click "Connect with Slack" (OAuth) is available, or skip it entirely and paste a Bot Token directly — both work.
📚 Knowledge — Confluence / Docs / Jira history
Why: feeds "similar past incident" matching and matched remediation runbook steps.
Past Jira tickets and Confluence runbooks import from the Docs / Links / API card. A pasted webpage or Google Doc link works too — a raw PDF link doesn't (paste its text instead).
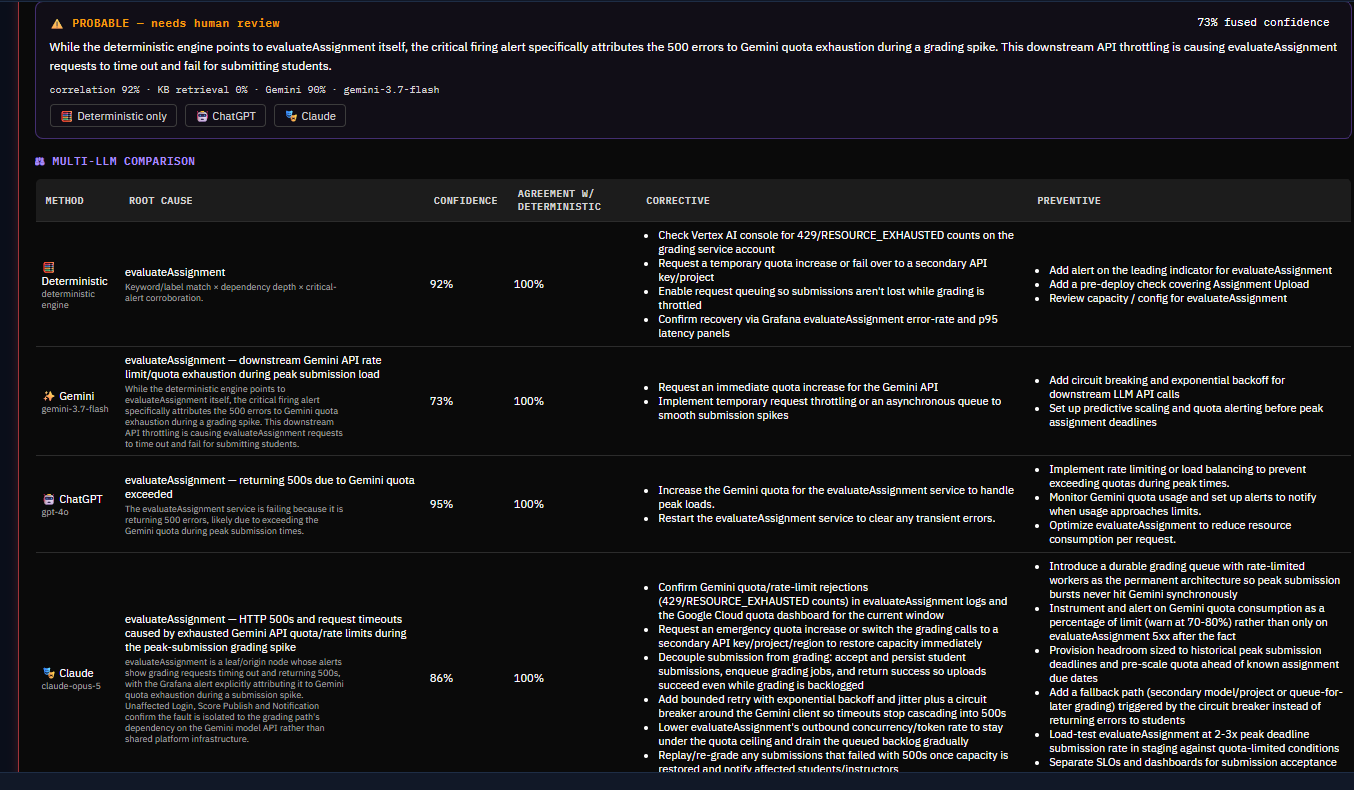
✨ AI Providers — Gemini / ChatGPT / Claude
These are configured centrally, not per-install — one admin sets them once in the admin panel and every Stratos user on the account picks them up automatically, no per-browser setup or redeploy needed.
Part B — Configure Your Business Flow (Layer Configuration)
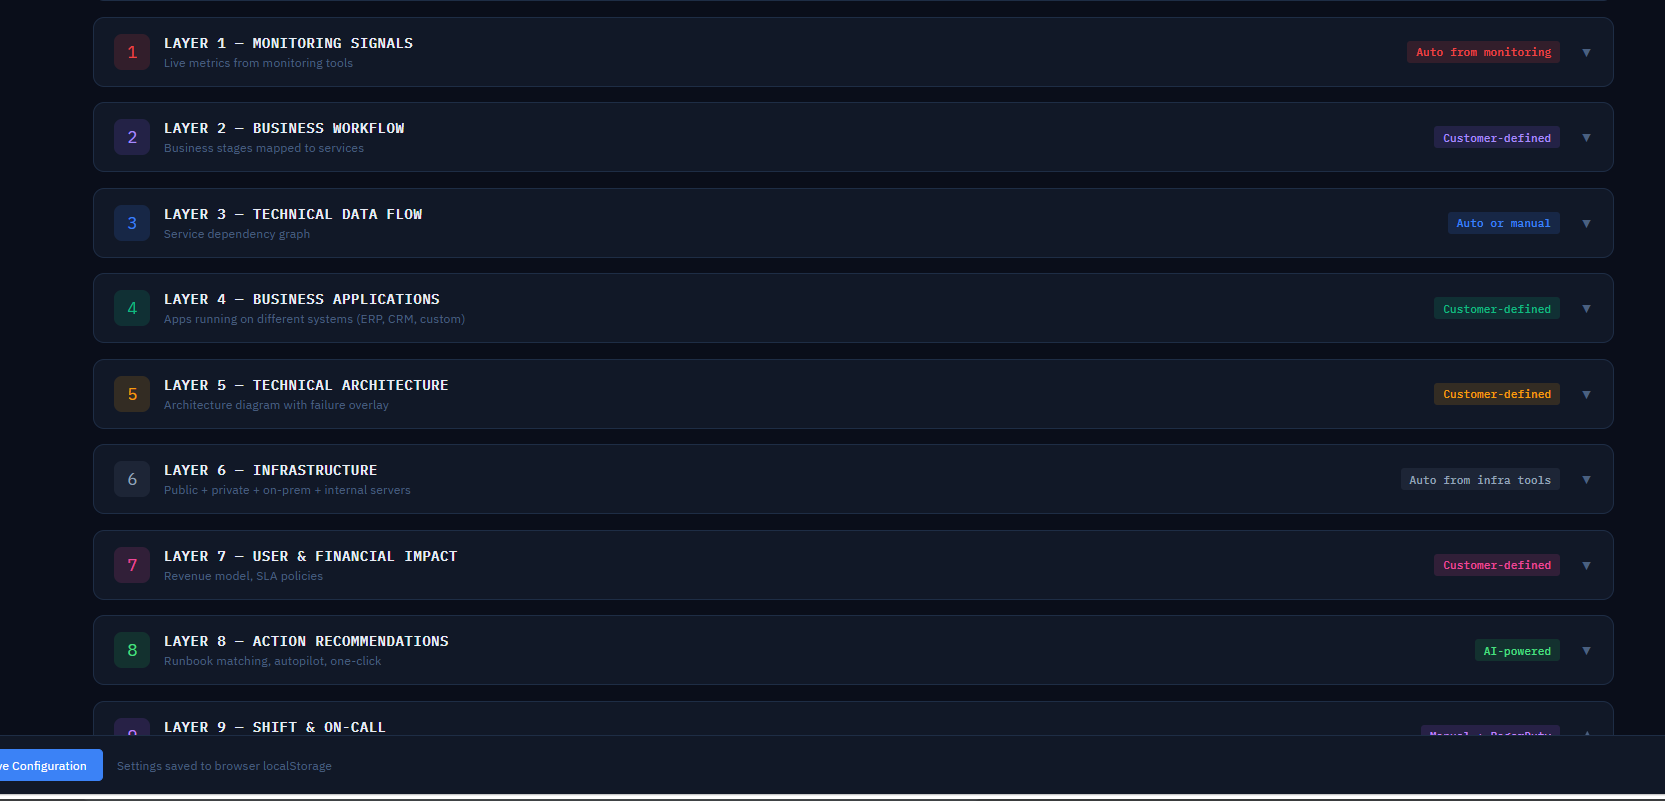
This is what makes a root cause map back to an actual business step, not just a server name. Layers are defined once and reused for every incident:
| Layer | What you define |
|---|
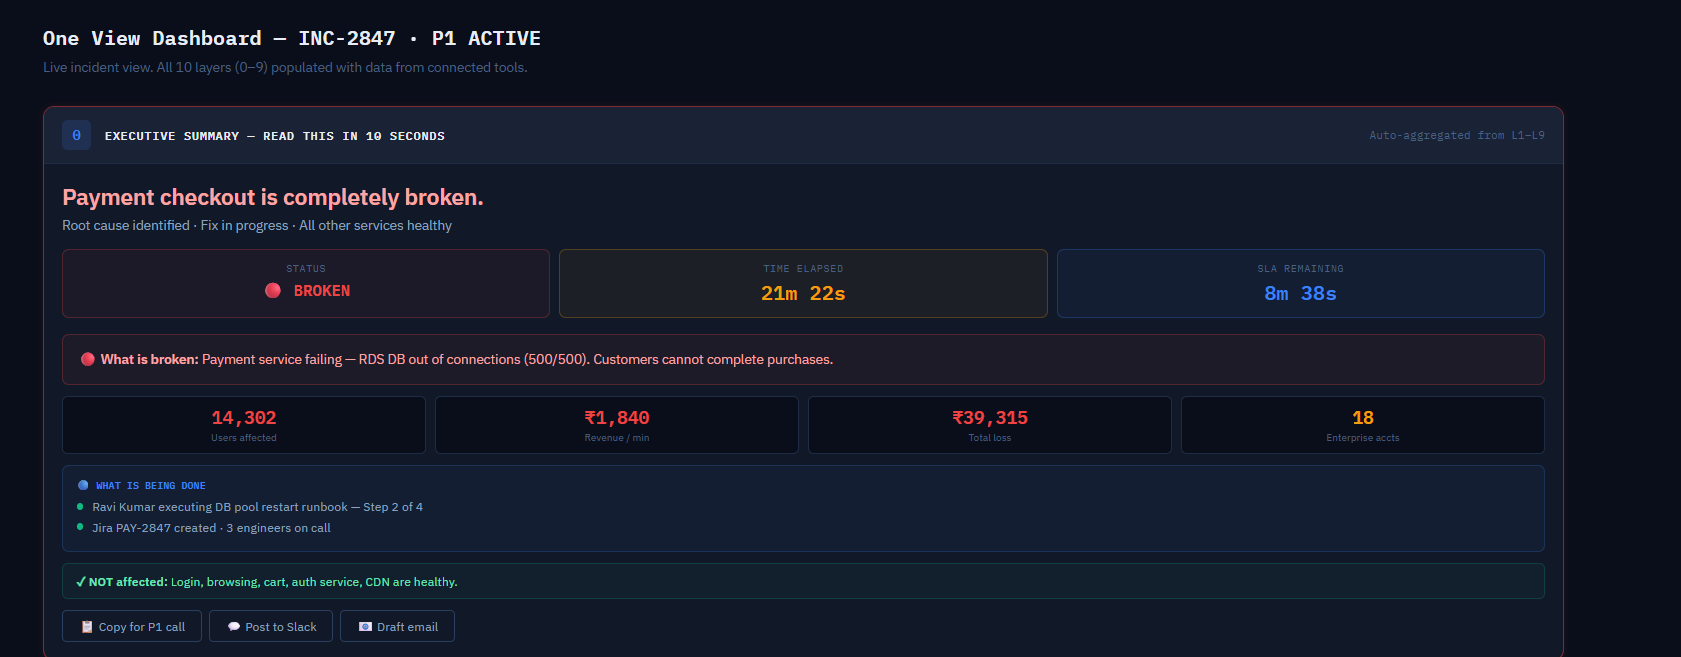
| L0 · Executive Summary | Auto-generated — no setup. |
| L1 · Monitoring Signals | Auto — pulled from connected monitoring tools. |
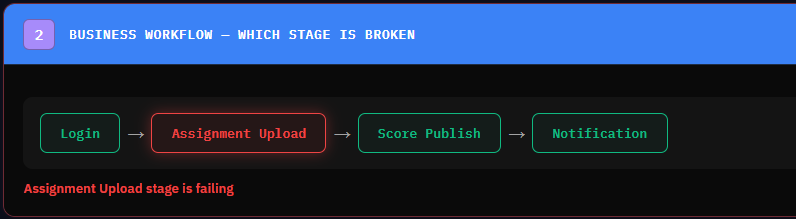
| L2 · Business Process Stages | Your customer journey (e.g. login → cart → payment → fulfilment), mapped to technical services. |
| L3 · Service Dependency Graph | Who depends on whom — drives "origin node vs. symptom" reasoning. |
| L4 · Business Applications | Your app inventory. |
| L5 · Technical Architecture | Services, components, how they connect. |
| L6 · Infrastructure | Auto — pulled from connected infra tools. |
| L7 · User + Financial Impact | SLA minutes, revenue/min, affected user counts per stage. |
| L8 · Actions / Runbooks | The fix steps Stratos recommends per known failure pattern. |
| L9 · External Dependencies | Third-party services you depend on. |
Once Parts A and B are done, every future alert automatically walks this flow — no per-incident setup.
This is for anyone who just needs to look at incidents — no setup, no credentials, nothing to configure.
Where to Go
| Screen | What it's for |
|---|
| 🎫 Incidents | Your team's open P1/P2 queue. Click any ticket to open its live One View. |
| 📊 One View Dashboard | The full incident page for whichever ticket/alert is currently active. |
| 🔄 Monitoring Aggregator | A reconciled "who's actually broken" view when multiple monitoring tools disagree. |
How to Trigger a Demo Incident
The Incidents tab includes a Scenario Library with 7 realistic preset incidents (e.g. "Payment gateway not reaching — DB connection pool exhausted"), plus your team's live Grafana alerts and open Jira tickets as additional triggers.
- Switch MY MODE (top right) to 🧪 Personal sandbox — this keeps your mock alert on your screen only, so exploring the product never creates a "real" incident your team sees. (This is the default and only option on a Pilot trial.)
- Open the Incidents tab.
- Pick a preset scenario card, a live firing alert, or an open Jira ticket.
- Click ⚡ Trigger — find root cause.
- Stratos builds the full One View instantly — the same engine runs identically on sample data as on a real alert, so this is a safe way to see exactly what a real incident looks like.
How to Browse the Multi-Layer View
Every incident's One View is built from the same L0–L9 layers your admin configured (see Part B above) — each one is its own collapsible card:
- Click any layer's header to expand or collapse it individually.
- Expand all / Collapse all buttons at the top do it for every layer at once.
- Layers flagged critical (a red pulsing border) are the ones actually on the blast-radius path — everything else is context.
Reading the One View Dashboard, Top to Bottom
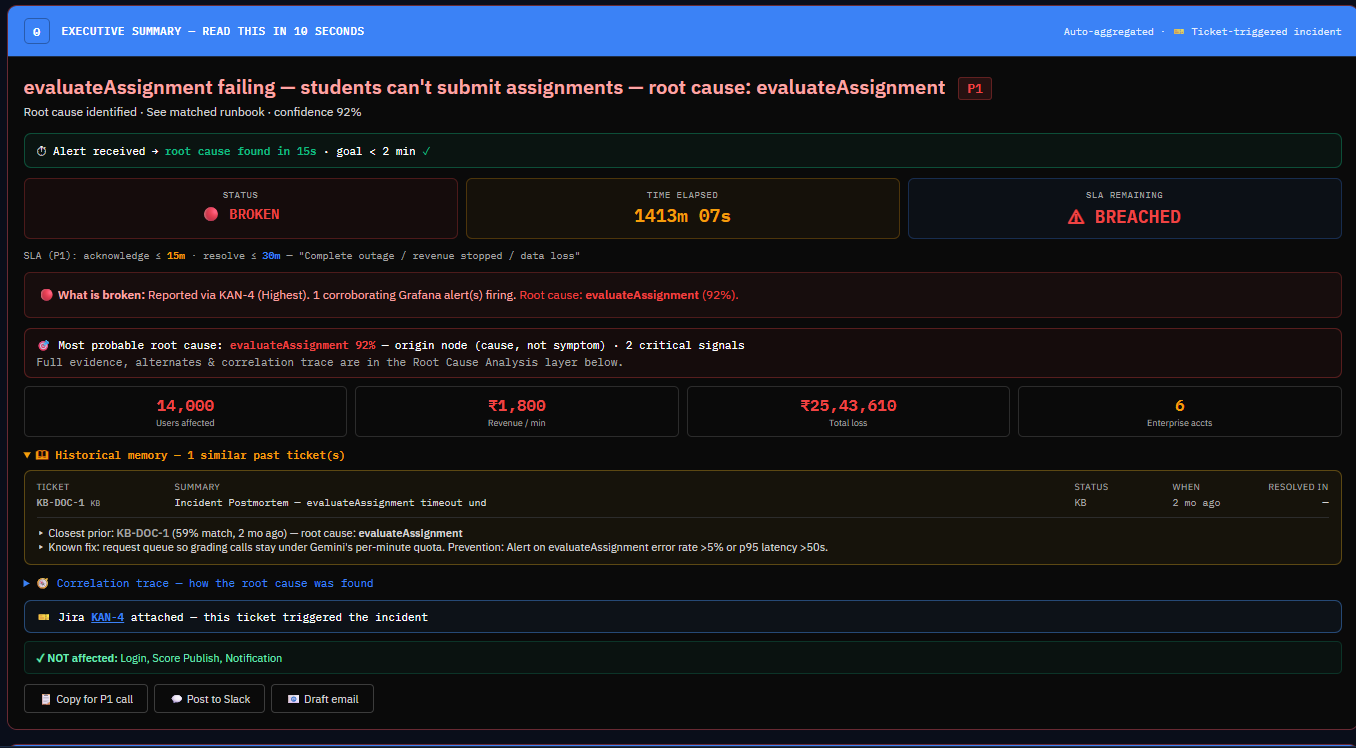
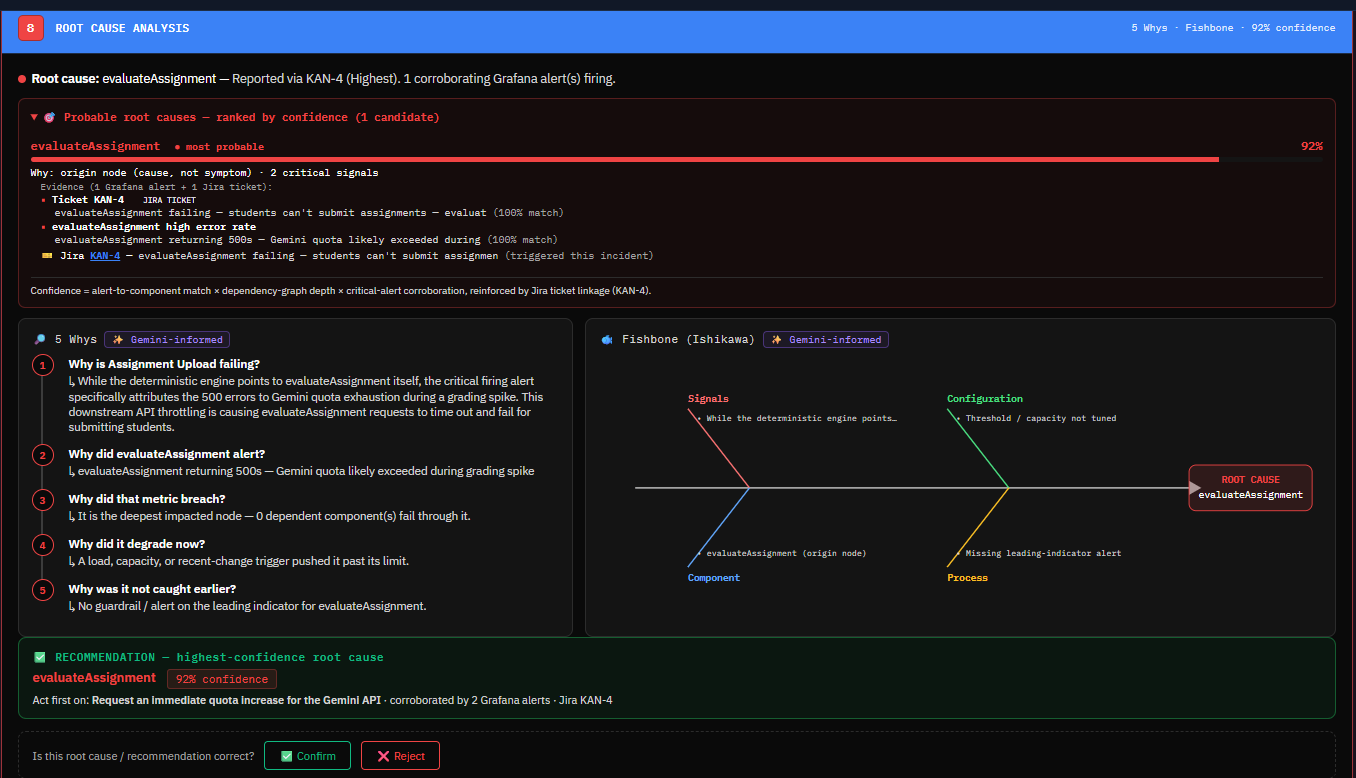
- Headline + confidence % — the one-line summary and how sure Stratos is about the root cause.
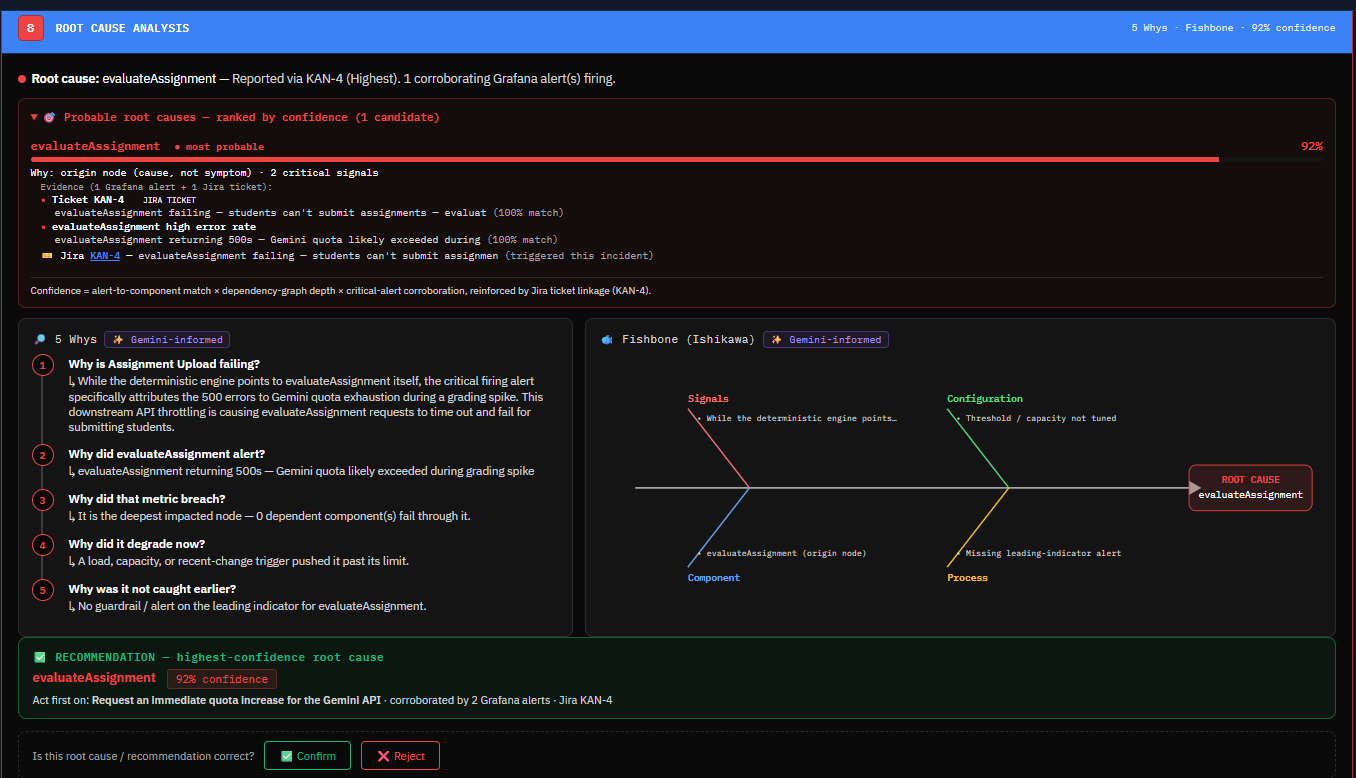
- 🎯 Probable root causes — ranked list; the top one is "most probable," with the evidence backing it shown underneath.
- 🕮 Historical memory — past tickets that looked similar, and how long they took to fix.
- 🔎 5 Whys / 🐟 Fishbone — auto-generated cause-analysis, same root cause, two formats.
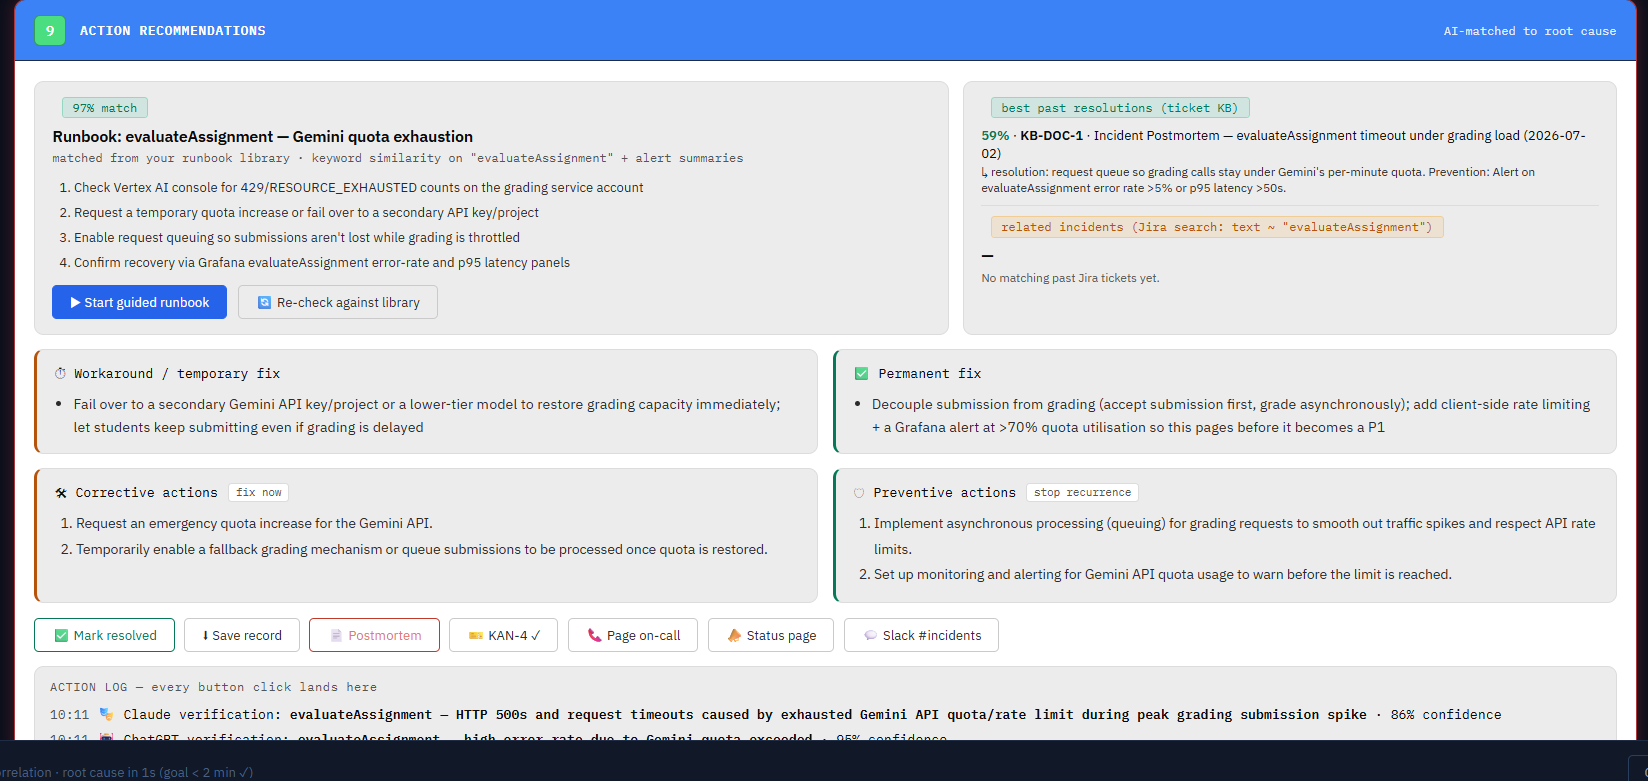
- ✅ Recommendation — the highest-confidence fix, plus matched runbook steps.
- Action buttons — Start runbook, Page on-call, Post to Slack, Mark resolved. Every click is logged in the Action Log at the bottom.
Generating a Postmortem
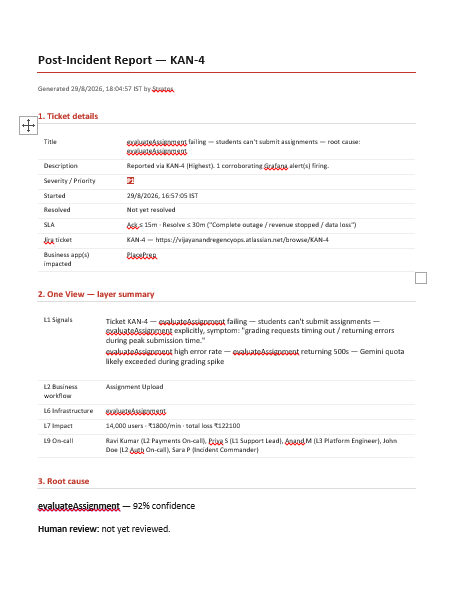
Once an incident is resolved, click 📄 Postmortem on its One View. Stratos compiles ticket details, every layer shown on screen, the root cause, a full sequence of events, and an action plan — then downloads it as a Word (.doc) file and opens a print/Save-as-PDF tab, ready to share or archive.
What You Can't Do Here
Configuration is hidden for Viewer accounts — you can't add or change connected tools or credentials. If a connection needs updating, ask your Stratos admin (see the Admin guide above for who that typically is on your team).